Particle Classification
Particle identification using convolutional neural networks
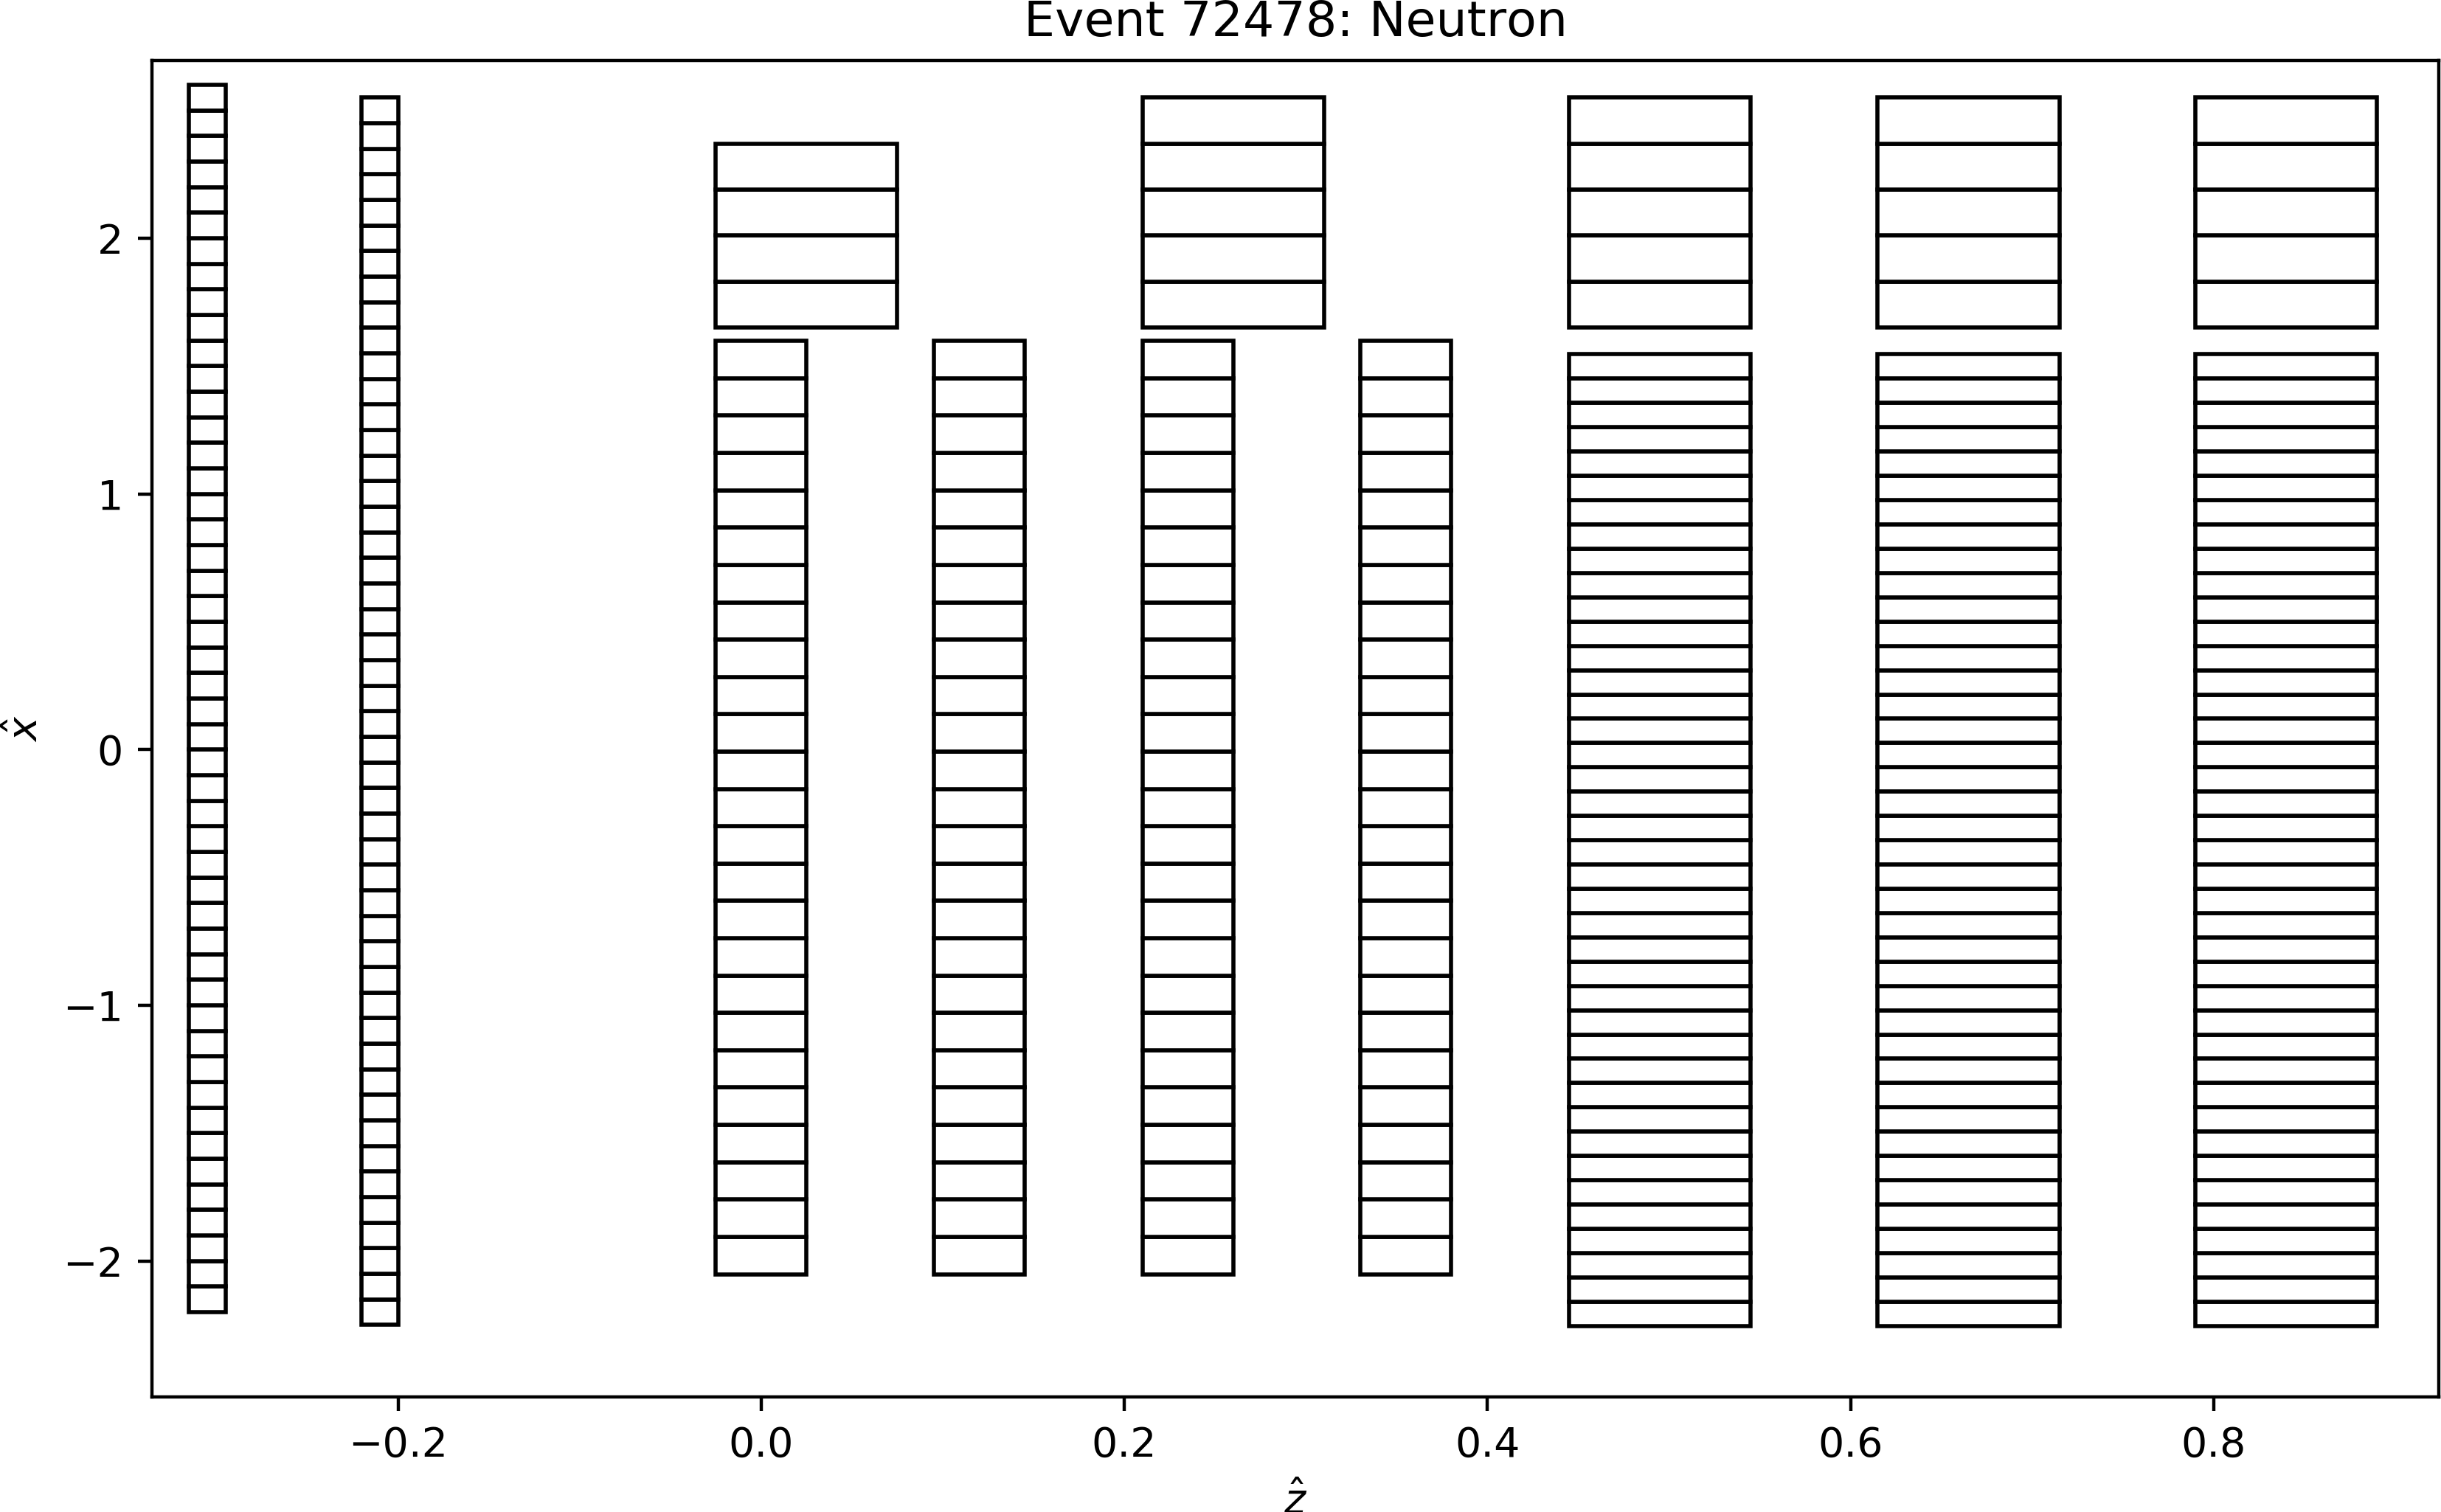
Table of Contents
Understanding how neutrons and protons are classified within the BigHand detector package represented an important analysis task during my PhD thesis; the original method will be discussed briefly. I have revisited the classification problem roughly one year later except in this case I will be using machine learning tools, specifically a random forest model and a convolutional neural network (CNN) approach. The newer methods produce outstanding results and have greatly increased the classification accuracy relative to the original machinery. By far the most difficult task was acquiring the appropriate data, and conditioning it such that a CNN may be used.
BigHand Detector
Let me start with this: the BigHand detector is complicated and analysis tasks are generally a mess. I am not going to discuss the detector or geometry in detail as I have exhaustively described it in my thesis and in a Phys. Rev. C long archival document that is currently being prepared (99% completed). The geometry may be seen by Fig. 2.
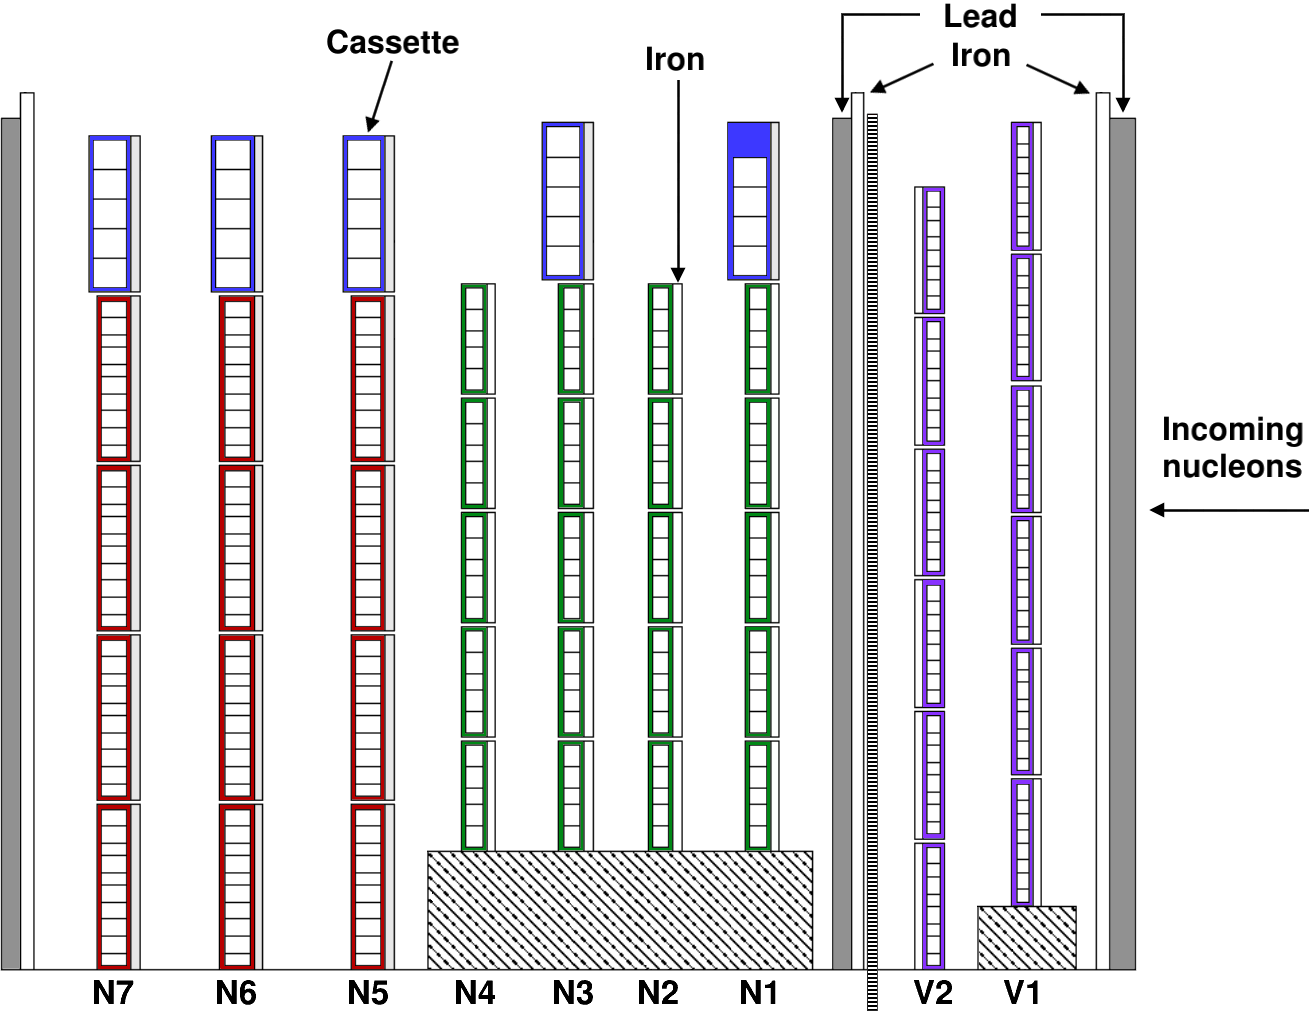
BigHand was an amalgamation of five types of scintillating bars, two (three) for the veto (neutron) layers which are labeled as V1 and V2 (N1-N7) within Fig. 2, respectively. Bars of a particular type were organized into cassettes, or modular units consisting of ten or less scintillating bars for structural integrity, which were stacked to form a plane. With the exception of the second veto plane, all cassettes had 1 cm of lead or iron on the target side to increase the probability of inducing a hadronic shower. The veto planes had 48+48 scintillating bars, and the seven neutron layers labeled N1-N7 consisted of 29, 25, 30, 25, 45, 45, and 45 bars, respectively. In total, the detector had 340 modules; the energy deposition in these 340 modules will be the features for the machine learning approaches.
Physics Inspired Classification
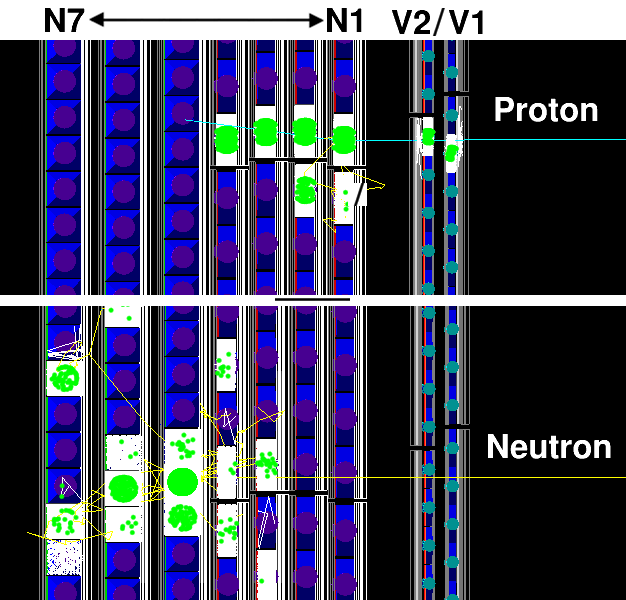
The goal of BigHand was two-fold: 1) reconstruct the momentum of a recoiling proton or neutron (collectively referred to as a nucleon) and 2) particle classification, i.e. algorithmically decide whether the particle was a proton or a neutron. Detector planes N1-N7 were responsible for momentum reconstruction via an energy deposition clustering procedure; this cluster is classified as proton or neutron by exploiting time and spatial correlations between the cluster and hits within the veto layers (V1 and V2). The underlying principle takes advantage of the fact that charged particles like protons emit light (or scintillate) within scintillating materials while uncharged particles like neutrons do not. Therefore, if a cluster is formed but no correlated hits are found within the veto layers, then this event is classified as a neutron. On the other hand, if a cluster is found in addition to correlated hits within the veto layers, then this particle is classified as a proton. See Fig. 3 for a visual summary.
This method is physically intuitive and satisfying as we exploit processes that we think we understand very well. We make the assumption that neutrons do not deposit energy in the veto layers (we threshold this, but still this comment is valid). In practice, however, this turns out to be a mediocre assumption for a couple of reasons: 1) the shielding upstream significantly complicates things and 2) we are operating the detector in a noisy (or imperfect) environment. This leads to a mediocre neutron classification accuracy as our cluster-veto hits are assumed to be spatially correlated; therefore, if a neutron deposits energy in the veto layers and a cluster is formed, then this particle is assigned proton by the analysis. In other words, this approach misidentifies these types of events every time. This analysis correctly classifies protons % of the time while the neutron accuracy is % which is just barely better than random guessing. The goal of the reanalysis is to do better with neutron classification while keeping the proton accuracy as high as possible.
Machine Learning Methods
Data Preparation
Acquiring and preparing the data for this machine learning analysis is by far the most difficult and time consuming part. When I analyze experimental data from the BigHand detector, I do not have access to the truth, i.e. the labels of the particles. We try our best by implementing the above physics-inspired scheme to identify particles, but I do not and will never have the ground-truth.
I did, however, spend a great deal of time during my PhD building a simulation that replicates the experimental data. The simulation utilizes Monte Carlo methods and frankly is beyond the scope of this post; the GEANT4 simulation framework has been used which is the standard in the field. In order to get the particle labels, two separate simulations are performed: 1) protons are generated using the ESEPP generator which incorporates the lowest-order QED (quantum electrodynamics) radiative corrections to the Rosenbluth cross section among other things, and 2) a fictitious neutron target that follows the lowest-order QED rules of electron-neutron scattering. Both particles are directed towards BigHand with an angular coverage that populates the detector acceptance that is consistent with what is expected/observed during experiment. The simulated energy deposition in the BigHand scintillator bars is modeled in multiple ways, e.g. the gain coefficients of the photomultiplier tubes are incorporated in addition to the bar-dependent attenuation of the scintillation. The simulated analysis incorporates the realistic trigger scheme (this is what trips the electronics for data-taking in real life), and all simulated physics variables faithfully reproduce what is observed during experiment. For more information, one must seek the details within my thesis.
For each event that initiates a BigHand trigger, the particle label and energy deposition of all BigHand bars are outputted resulting in a table of approximately 180k rows (corresponding to events) and 341 columns (340 correspond to the energy deposition within the BigHand bars and 1 corresponds to the particle label). Neutron events make up roughly 61% of the data. This dataset represents the starting point for the machine learning methods. We will be using carefully chosen low-level detector information, namely energy deposition in scintillator post detector triggering, in order to build a proton/neutron classifier.
Note: the majority of the work required to obtain this dataset has been superficially discussed as I do not want to get too deep in the physics-related weeds. Additionally, the simulation that I have developed has been rigorously tested against the real data during the final 2 years of my PhD.
Random Forest Classifier
The features are the energy deposition of all BigHand modules which have been normalized by the maximum energy deposition for that event. I found that the results may be improved by removing the last two planes of BigHand from my feature space; this is not surprising to me because protons/neutrons generally do not propagate through the entire detector at this entire scale. The target or label is the proton/neutron simulation that has been briefly described above. Here are some details about the dataset:
Neutron data  - row, col: 108,635, 341
 Proton data  - row, col:  69,115, 341
All data      - row, col: 177,750, 341
Analysis data - row, col: 177,750, 250 (N6 and N7 removed)
Ratio of neutrons to protons: 61%
As usual, the data is goes through a train-test-split (30% for testing) and is fit to a Random Forest classifier with all default parameters except n_estimators=250. The prediction on the test dataset yields the following:
Total Accuracy: 91.17%

Proton  Accuracy:   17944/20725 = 86.58%
Proton  Inaccuracy:  2781/20725 = 13.42%
Neutron Accuracy:   30675/32600 = 94.10%
Neutron Inaccuracy:  1925/32600 = 5.90%
In other words, the Random Forest model correct classifies protons (neutrons) 87% (94%) of the time which is pretty remarkable. The most important features organized by detector plane is summarized by the following figure:
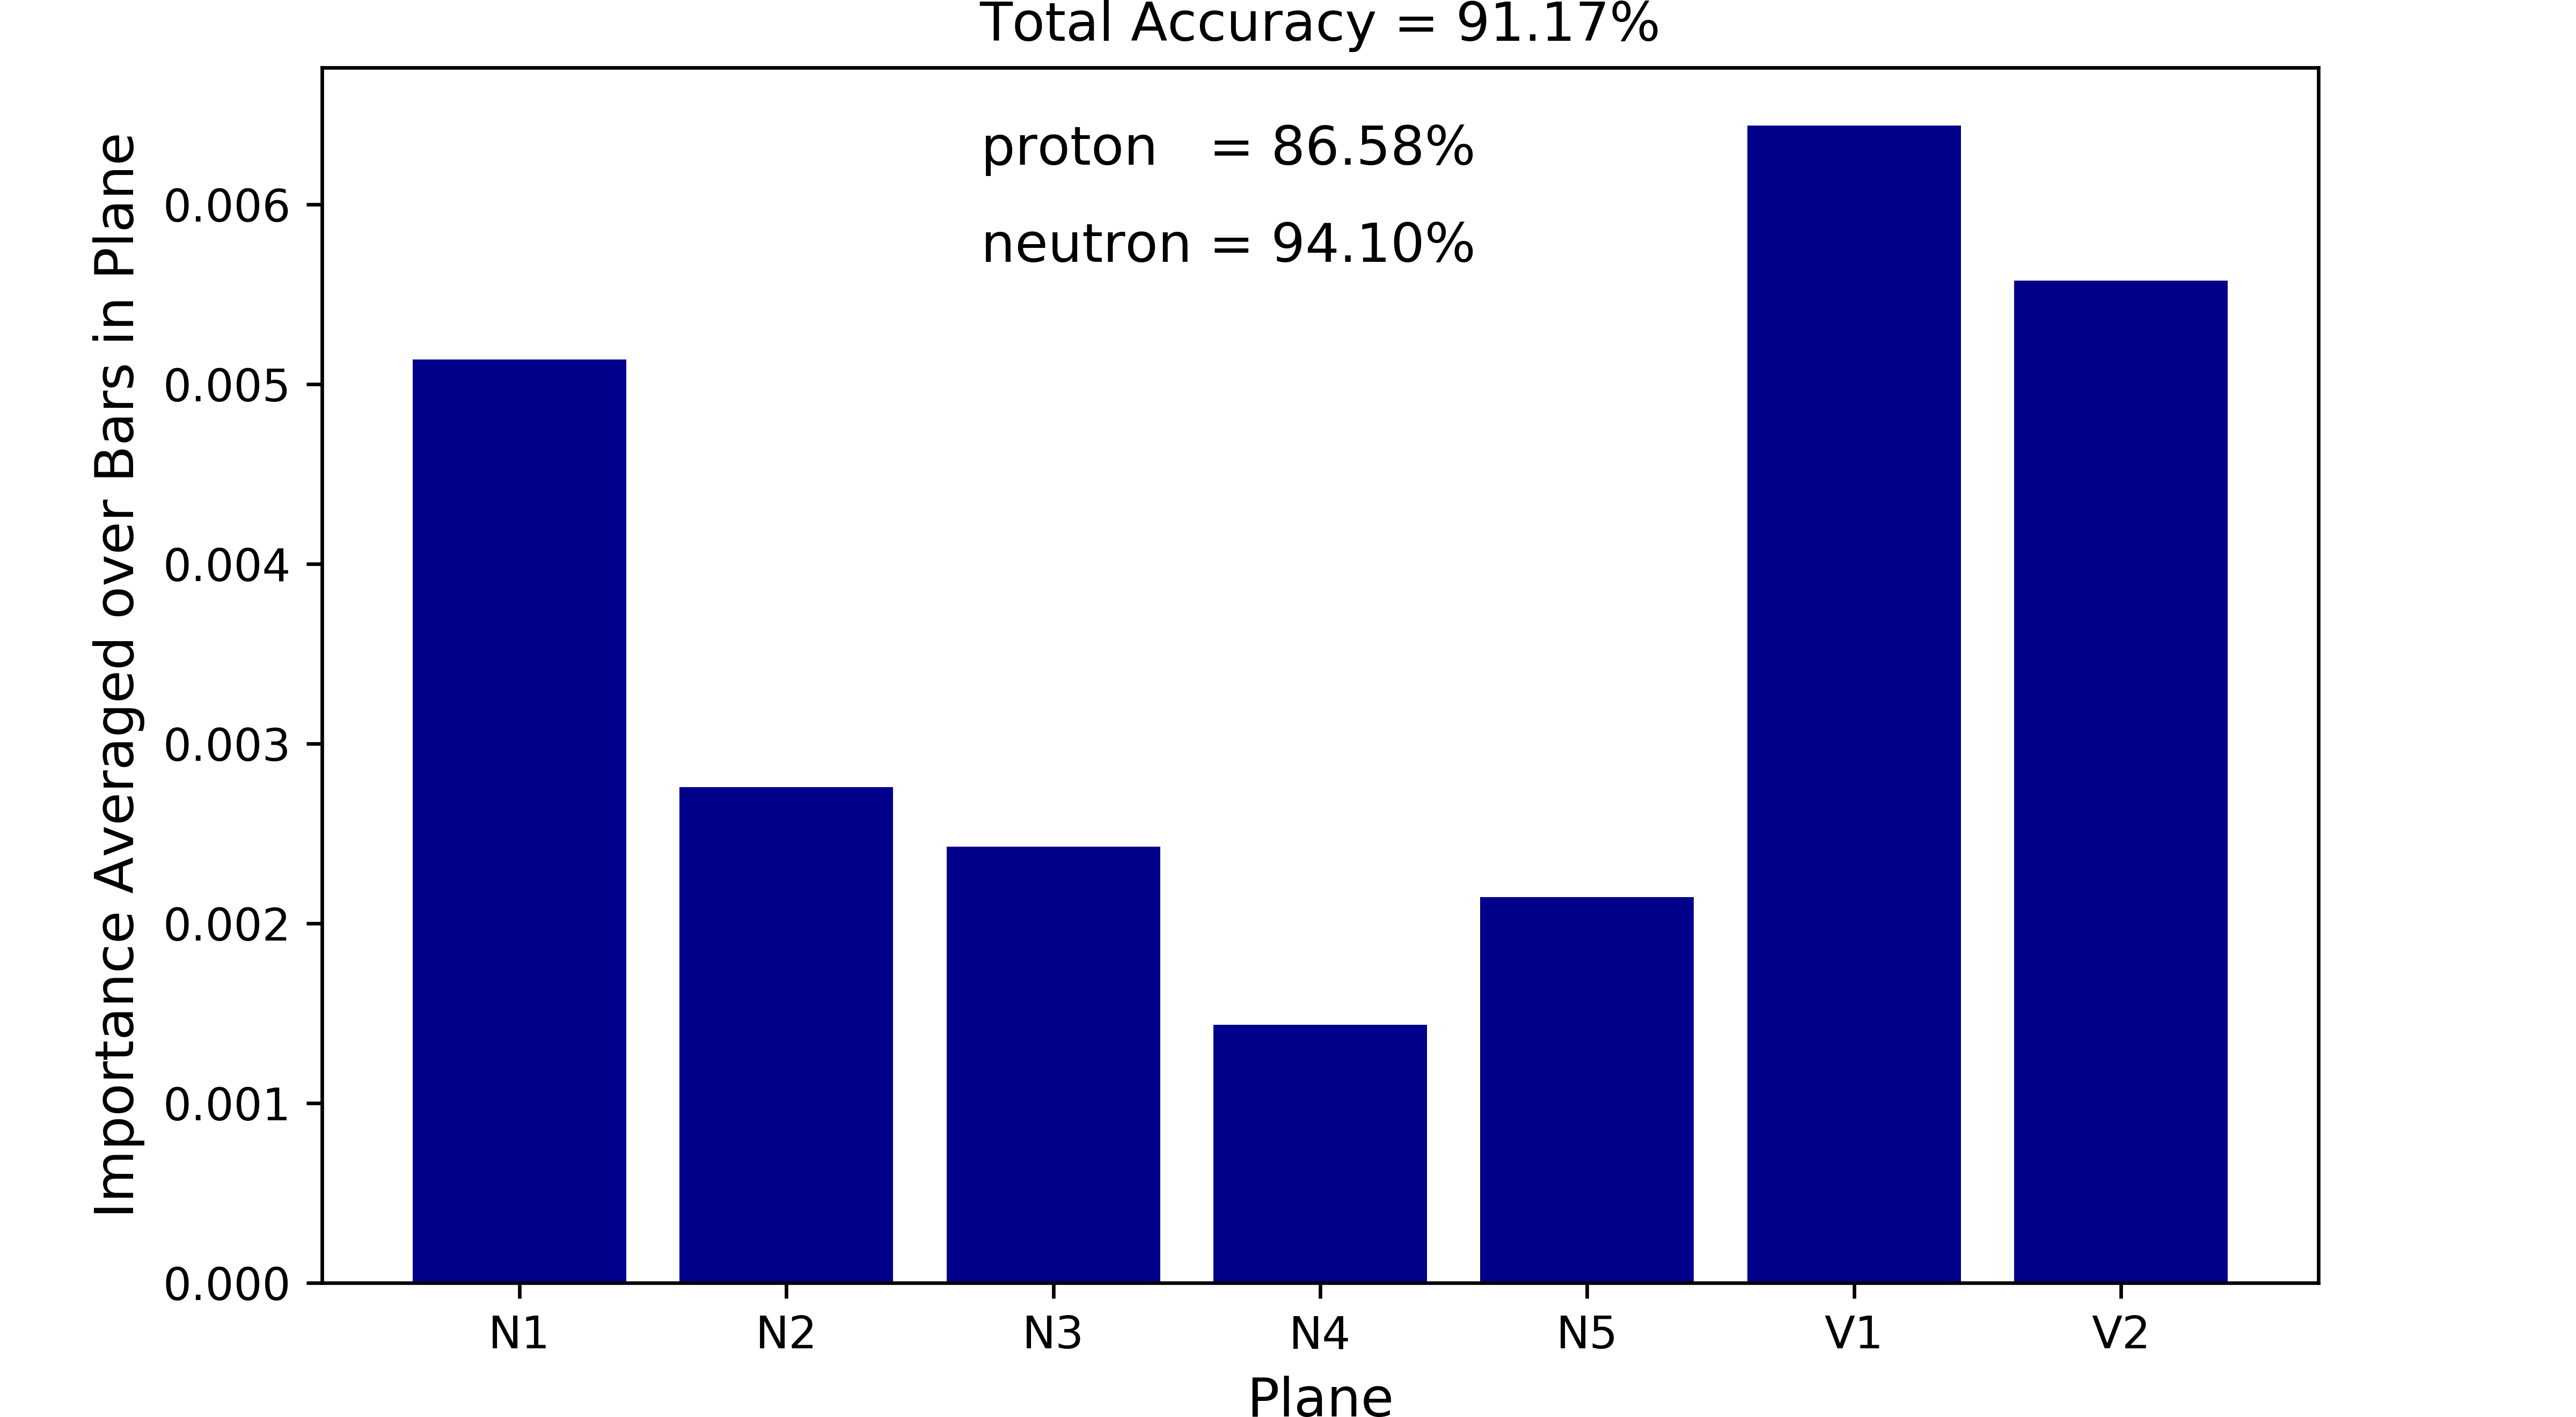
Fig. 4 indicates that the veto layers (recall that the physics-inspired methodology relies heavily upon the response within the veto layers for particle classification) and neutron plane N1 are the most important in regards to this classification task. Planes deeper in the detector become decreasingly important which is not a surprise to me. The Random Forest model will serve as a baseline for the convolutional approach, in other words can a CNN do better than 87% and 94% for protons and neutrons, respectively? Note that I did not spend additional time optimizing this model as I was more interested in the CNN approach for my own education.
Convolutional Neural Network
Converting BigHand Data to an Image
Protons and neutrons fundamentally leave different energy deposition patterns within BigHand, and by pattern I mean the modules that are fired as the particle traverses through the 9 detector planes. Here are a few examples:
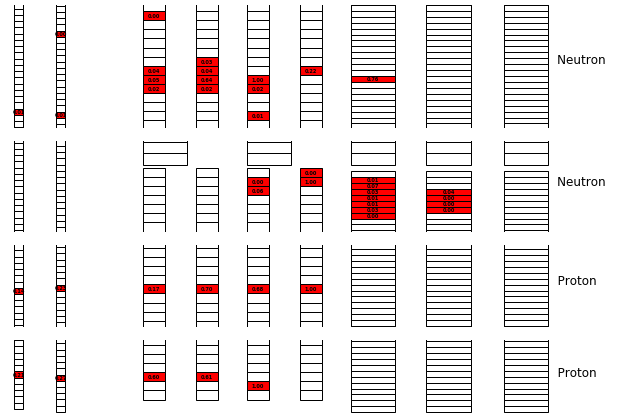
Visually, it is pretty easy to notice a few things: 1) neutrons leave messier patterns, 2) neutrons often leave signals in the veto layers (which is a flaw in our physics-inspired method), and 3) neutrons often travel deeper into the detector which is a consequence of the particles having no charge. A little more detail about the third point: as neutrons have no charge, they must interact with the iron and lead between detector planes in order to produce charged particles via the strong interaction. These charged particles then propagate through the BigHand modules and produce scintillation, resulting in a detectable signal that indirectly allows us to track the neutron.
Just by visually inspecting which modules fire during a proton/neutron event, we can begin to think of the detector as a two-dimensional image where the pixel strength (the 3rd dimension, often gray-scale or RGB) is normalized energy deposition. Now, the problem is we need to convert the detector data to a matrix that retains the spatial correlations between planes, but recall that e.g. the veto layers have 48 bars and cover a larger vertical dimension than say the N1 layer, which only has 29 bars (and the bars are different sizes too). We can cast/interpolate the BigHand energy deposition data for all layers to a grid of my choice where the grid extends from the BigHand vertical minimum/maximum extremes, and has been discretized to about 50 points for this analysis. For each event, each point within this new grid is associated to a BigHand bar and the energy deposition is linearly interpolated based off the grid position relative to the bar centers. Here is an example of the result:
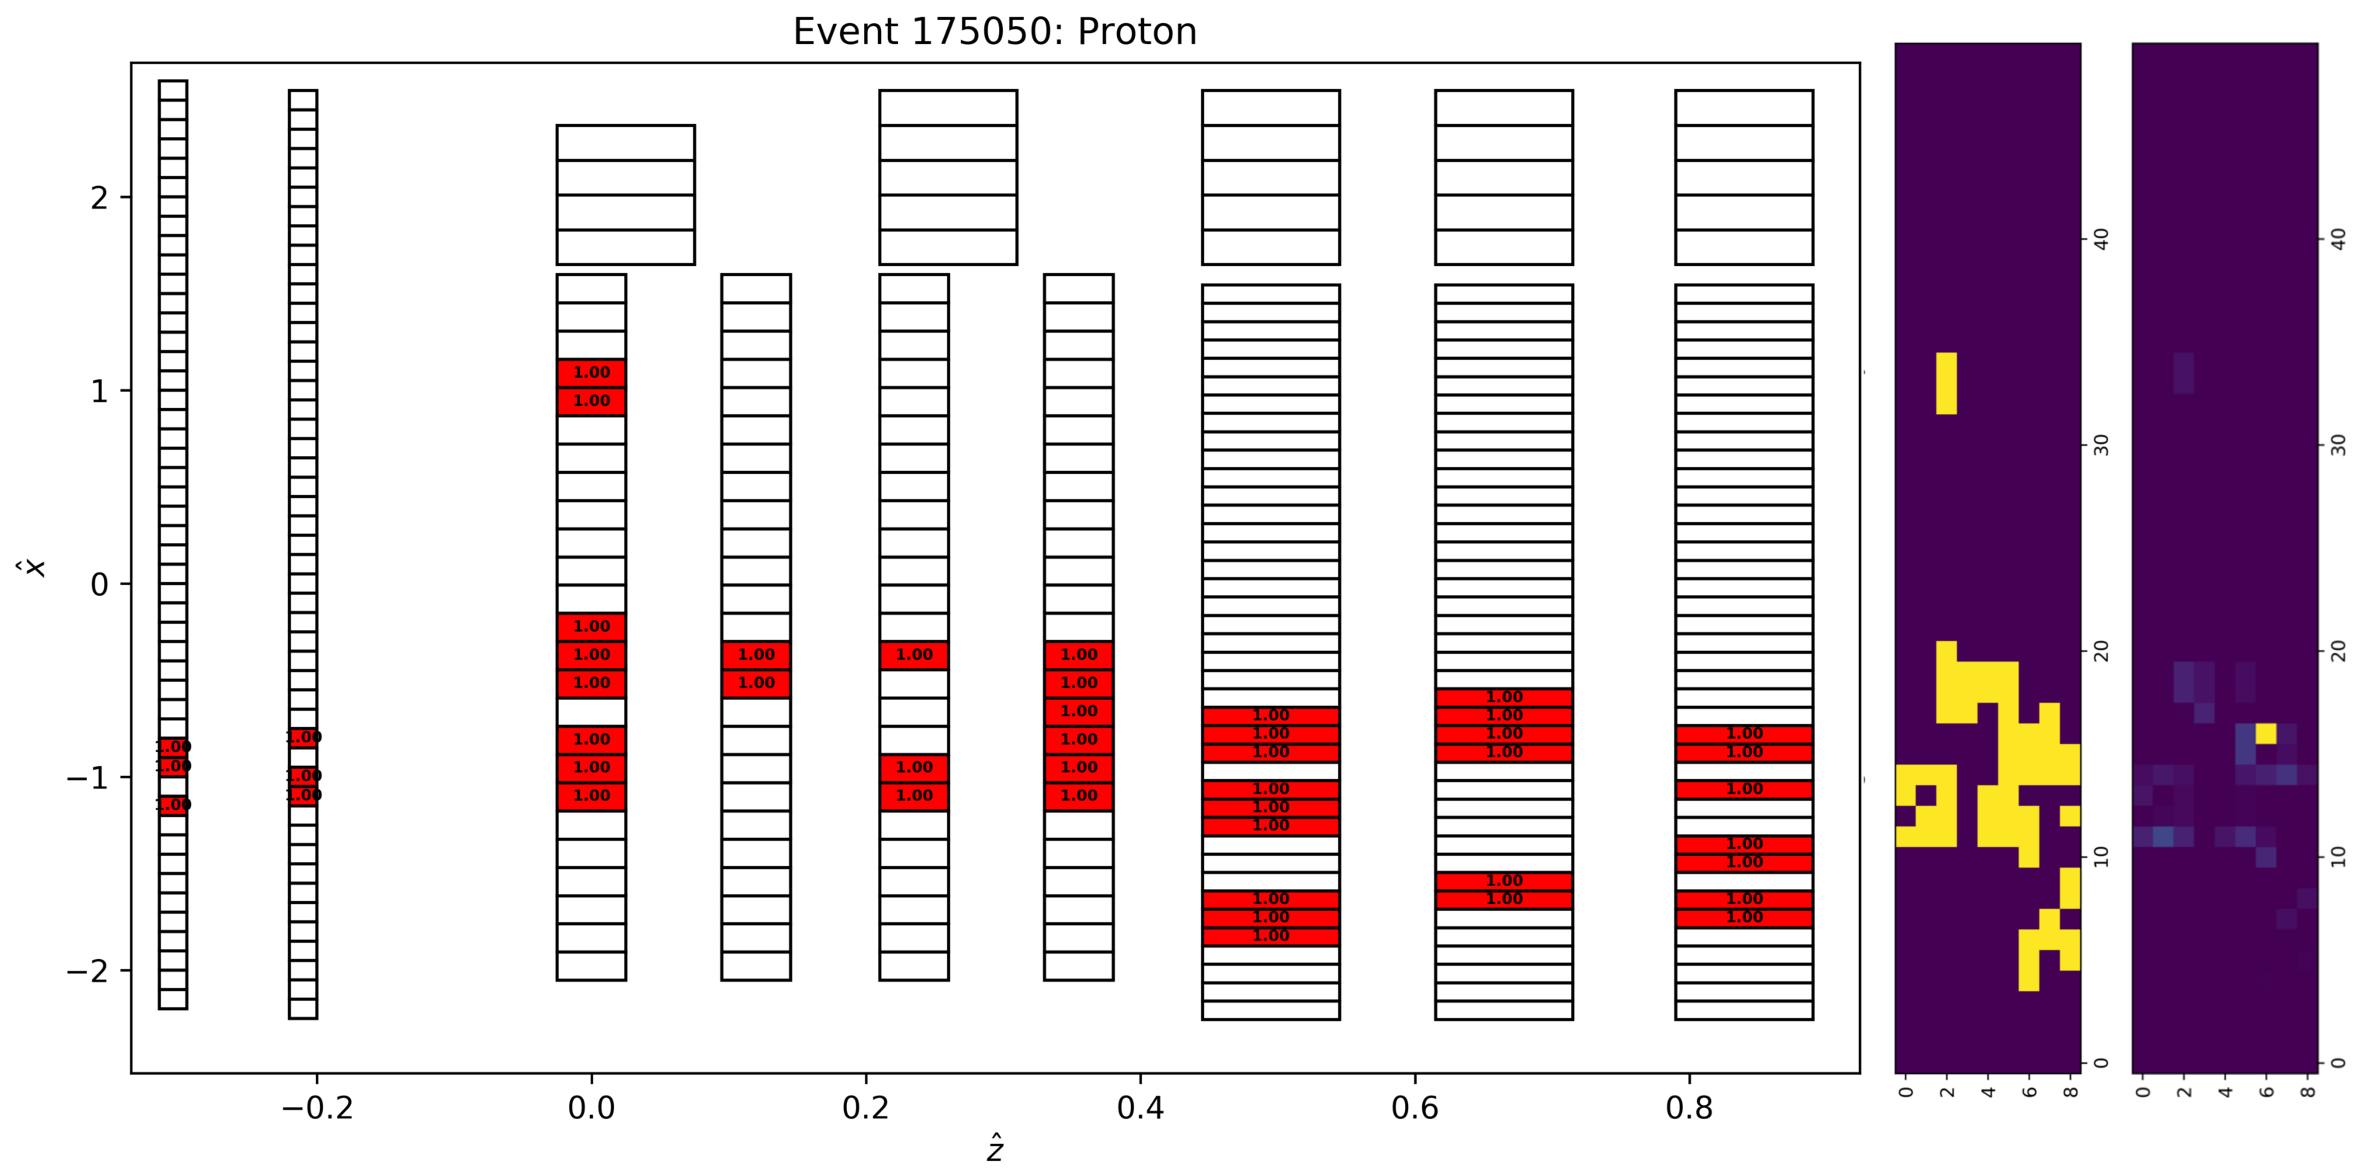
The middle and right images are 9501 where the 9 corresponds to the number of detector planes, the 50 is how I chose to discritize the vertical dimension, and the last dimension is the image color-scale which is now the normalized energy deposition. We will use these images as input to a convolutional neural network to do image classification.
Architecture
Standard strided convolutional blocks are used:
class ConvModel(nn.Module):
    def __init__(self, nplanes):
        super(ConvModel3, self).__init__()
        self.nplanes = nplanes
        self.conv1 = nn.Conv2d(1, 32, kernel_size=5, stride=1, padding=1)
        self.norm1 = nn.BatchNorm2d(32)
        self.selu = nn.SELU()

        self.conv2 = nn.Conv2d(32, 64, kernel_size=3, stride=(1,2), padding=1)
        self.norm2 = nn.BatchNorm2d(64)

        self.conv3 = nn.Conv2d(64, 128, kernel_size=3, stride=(1,2), padding=1)
        self.norm3 = nn.BatchNorm2d(128)

        self.conv4 = nn.Conv2d(128, 2, kernel_size=1, stride=1, padding=1)

    def forward(self, x):
        x = self.conv1(x)
        x = self.selu(self.norm1(x))
        x = self.conv2(x)
        x = self.selu(self.norm2(x))
        x = self.conv3(x)
        x = self.selu(self.norm3(x))
        x = self.conv4(x)
        x = nn.functional.adaptive_max_pool2d(x, (1,1))
        x = torch.squeeze(x)
        return x
In other words, the width and height dimensions are reduced while increasing the number of filters. Layers are normalized using BatchNorm, and the SELU activation function is used.
Results
| Physics Method | Random Forest | CNN | |
|---|---|---|---|
| Proton Accuracy | 97% | 87% | 90% |
| Neutron Accuracy | 55% | 94% | 94% |
The table above summarizes the performance of BigHand using a variety of classification techniques. Each method has a set of advantages and disadvantages that must be assessed prior to use in analysis.
For a neutron form factor measurement, keeping the proton/neutron accuracy high is desirable. An important consequence of doing a better job with the neutron accuracy is the reduction in the statistical error on the final result. The machine learning methods increase the neutron accuracy by roughly a factor of 2, technically 1.7 but I am rounding. Therefore, the analysis can use more neutron events in the neutron form factor calculation, which means the statistical error bar gets reduced by roughly a factor of . Reducing the error bars on final measurements is always important and time-consuming. In this case, the measurement was dominated by the statistical uncertainty (as opposed to the systematic), and an improved classification algorithm increases the precision of our neutron form factor measurement.