K-means clustering
An unsupervised clustering algorithm

Summary
Overview of the problem
We are given objects each of which have features but no class labels. Therefore, an unsupervised algorithm such as -means clustering may be utilized in order to group data of similar features; the output of my implementation may be seen by Fig. 1. The phrase “similar features” is quite ambiguous, however the most naive interpretation may be thought in terms of distance. In other words, similar objects are defined to be objects that are close together in terms of the square distance:
where the simplification is a result of only working with two features, and the superscript refers to vector-transpose. In order to automate this procedure for a data set that looks like the left-panel of Fig. 1, then a cluster needs to be defined more clearly.
Clustering algorithm
In -means, there are clusters (e.g. 4 clusters in Fig. 1) that are defined by the feature-space mean using the data points constituting the cluster in the calculation, i.e. in the space one needs to calculate the average in both variables but only using data points that have been determined to be within the cluster. The argument is circular; we need a mean-point to define a cluster and yet the cluster needs points to calculate the mean. In order to overcome this strange logic, the mean-vector for the cluster is defined as
where is a binary variable which is equal to 1 if the data object is a part of cluster , and zero otherwise; this is simply a weighted average, and keeps track of how many objects are in cluster . Randomly initialize for the clusters. It is best to keep the randomization within the bounds of the data, otherwise a cluster may not develop. Randomly assign all unlabeled data to a cluster; therefore, a book-keeping device (an integer ranging from 0 to 3 in Fig. 1 for example) is required for each data object to track cluster assignment. The following procedures are then performed iteratively:
- For each data object, calculate the distance between and for the clusters, i.e. find that minimizes . The data point is assumed to be a member of the cluster that yields the smallest distance, i.e. update the data-object’s book-keeping device to reflect this change, if any. If no updates are required, then exit the iterative-loop.
- If we are here, then the book-keeping device of at least one data-object has been updated; therefore update by recalculating the weighted-averages to reflect this change.
- Return to procedure 1.
In the above example, the unlabeled data has been classified or organized into five clusters (blue square, green triangle, red circle, purple upside-down triangle, copper cross). The black stars, which represent or the mean of the cluster, move around due to the above update rule; the algorithm stops once the data-object’s book-keeping device is no longer updated.
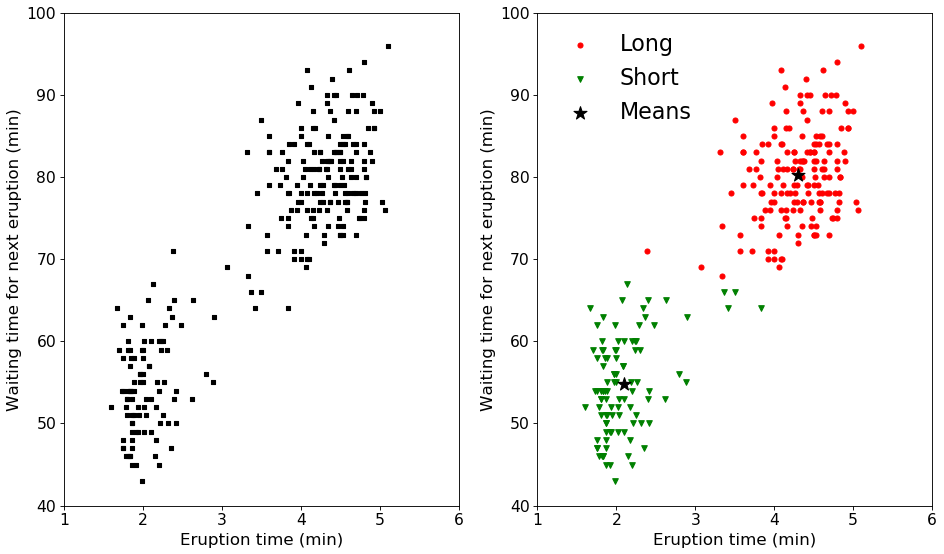
Application to Old Faithful
Data from more than 270 observations on the Old Faithful geyser may be found here. We are given the duration of the current eruption in addition to the waiting time for the next eruption. The data distribution may be seen by Fig. 3, which is clustered into two groups, labeled long and short, using K-means. In short, the eruption time is either short or long , which means that we have to wait a short (roughly 55 min) or long (roughly 80 min) time until the next eruption. Note this data is almost 30 years old, and consequently current predictions may differ. The uncertainty in this prediction is roughly , which comes out to be about minutes; so get there early just in case!