Plinko
Simulating the famous plinko game
Objective
Plinko is a popular game perhaps due to “The Price is Right”. A contestant gets up to 5 plinko chips (piece of plastic that resembles a hockey puck), each of which are worth up to $10,000. The idea then is quite simple; the contestant chooses an initial starting point at the top of the board and releases the plinko chip, and hopes to win some money ($0, $100, $500, $1k, $10k are possible outcomes). The fun part, though, is watching the chip traverse the plinko board. The board is an array of metal pegs, each row is offset by half a lattice spacing, which forces the chip to change its trajectory many times. The bin where the chip ends up dictates how much money is awarded, if any at all, to the contestant. On the show, there are 9 bins and the center bin is the $10k prize. Naively, the odds of obtaining the big bucks are 1/9, but the odds are initial-condition dependent as we will see.
Simulation
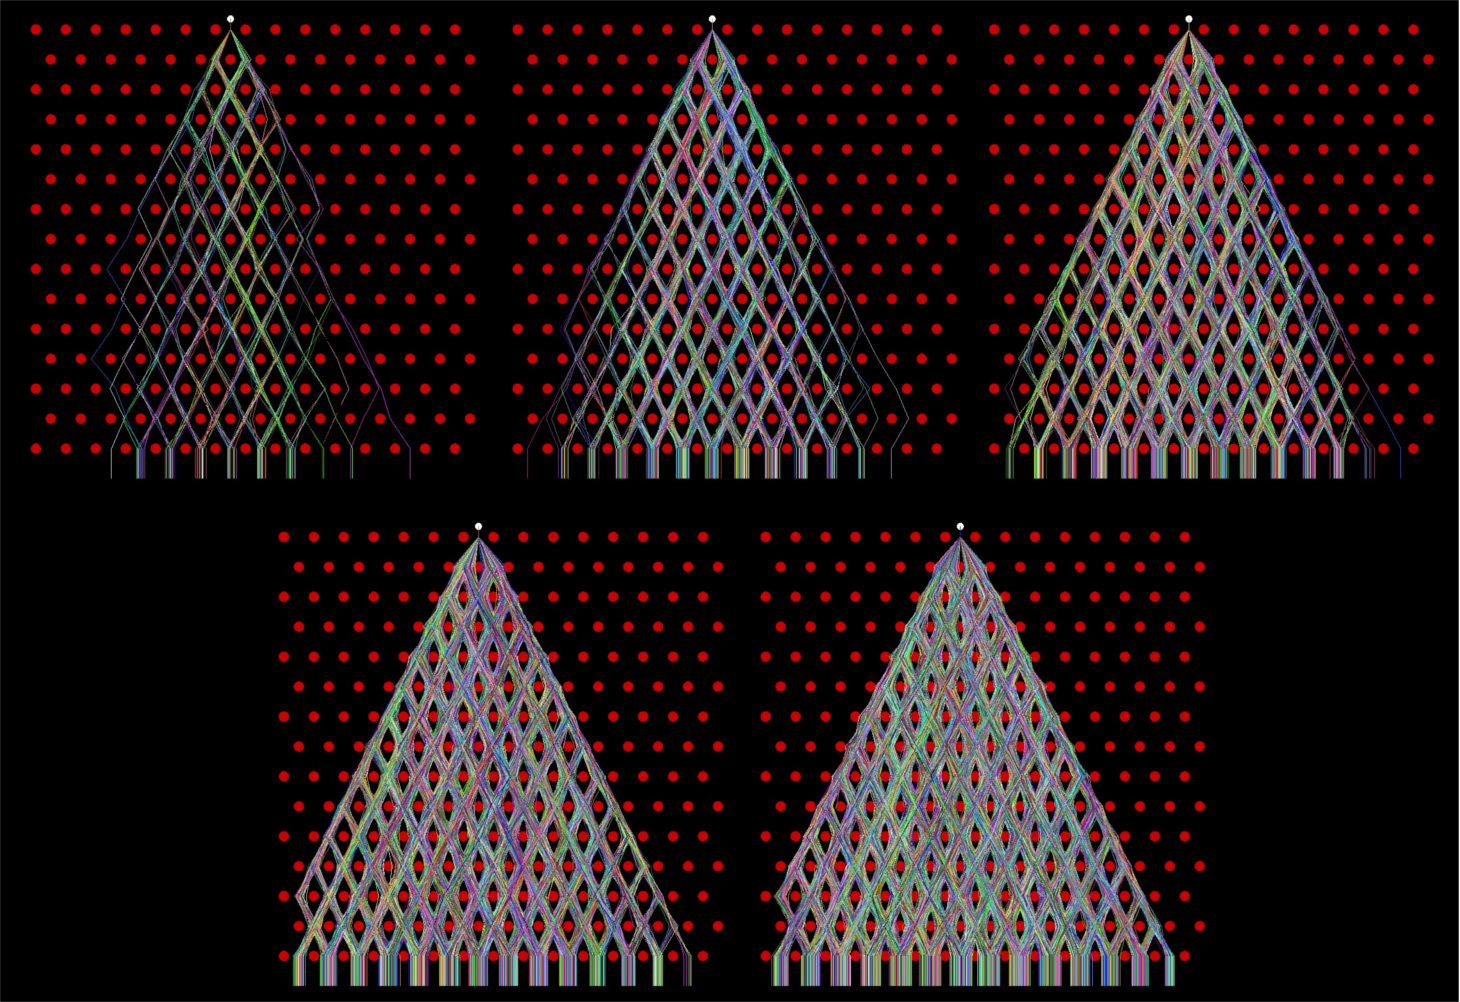
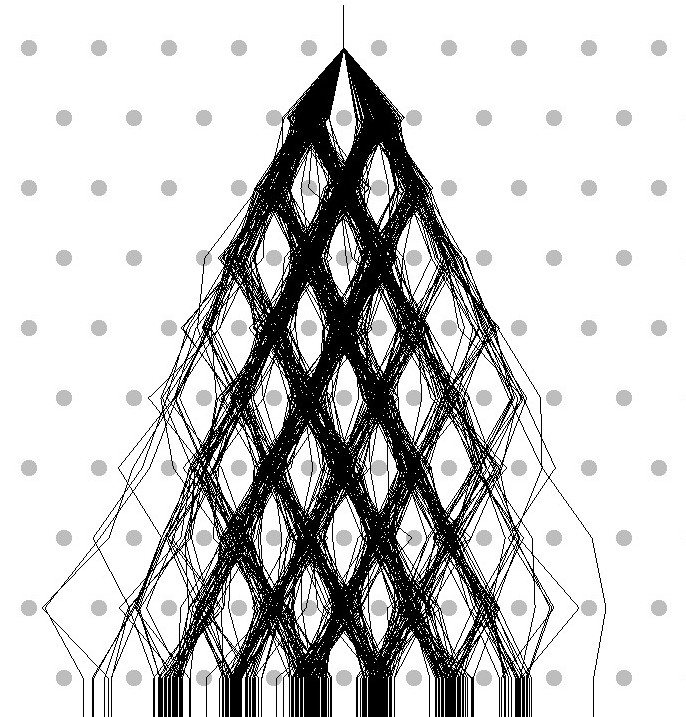
The simulation setup is summarized by Fig. 1 in which an NxN lattice is generated where every other row is horizontally offset by half a lattice spacing. The initial condition is chosen to be roughly the center as it provides the most interesting results visually. I initially wanted to do the simulation using billiard ball collisions and forces (momentum and energy conservation, etc.), but the situation can be dramatically simplified. When a plinko chip encounters a peg, let's randomly choose a direction to go, left or right, and propagate this strategy down the plinko board. If we repeat the game many times then we've achieved a simple Monte Carlo simulation. The situation is actually identical to a one-dimensional random walk (or drunken walk) which follows a binomial distribution. After many steps, the binomial may be well approximated by a Gaussian, and the most probable ending spot for the 1D drunkard is exactly where he started. Therefore, a naive expectation for the plinko simulation is the chip end-bin distribution to look like a Gaussian with a mean corresponding to the starting position and a standard deviation that depends on the lattice size or granularity of the board.
 The algorithm to generate a visualization of the plinko simulation uses techniques that I commonly use in my work.
We need an easy way to track the path of a chip; therefore, I need coordinates of all decisions. This can
be efficiently done by first creating a map, or table, that relates any given peg to its closest neighbors.
A simple radius clustering search may be used, but we are only interested in the two closest pegs
below as they dictate where the chip will move next. Lastly, the path of the chip needs to be traced, where
a path consists of many line segments that connect the left/right decisions throughout the board.
Since we are dealing with coordinates in a lattice,
I Gaussian-smeared the line segment coordinates to avoid an overlap of many paths in addition to
giving the path a more fluid feel. This is what gives the horizontal spread in the observed paths, and explains
why a path occasionally crosses a peg.
The algorithm to generate a visualization of the plinko simulation uses techniques that I commonly use in my work.
We need an easy way to track the path of a chip; therefore, I need coordinates of all decisions. This can
be efficiently done by first creating a map, or table, that relates any given peg to its closest neighbors.
A simple radius clustering search may be used, but we are only interested in the two closest pegs
below as they dictate where the chip will move next. Lastly, the path of the chip needs to be traced, where
a path consists of many line segments that connect the left/right decisions throughout the board.
Since we are dealing with coordinates in a lattice,
I Gaussian-smeared the line segment coordinates to avoid an overlap of many paths in addition to
giving the path a more fluid feel. This is what gives the horizontal spread in the observed paths, and explains
why a path occasionally crosses a peg.
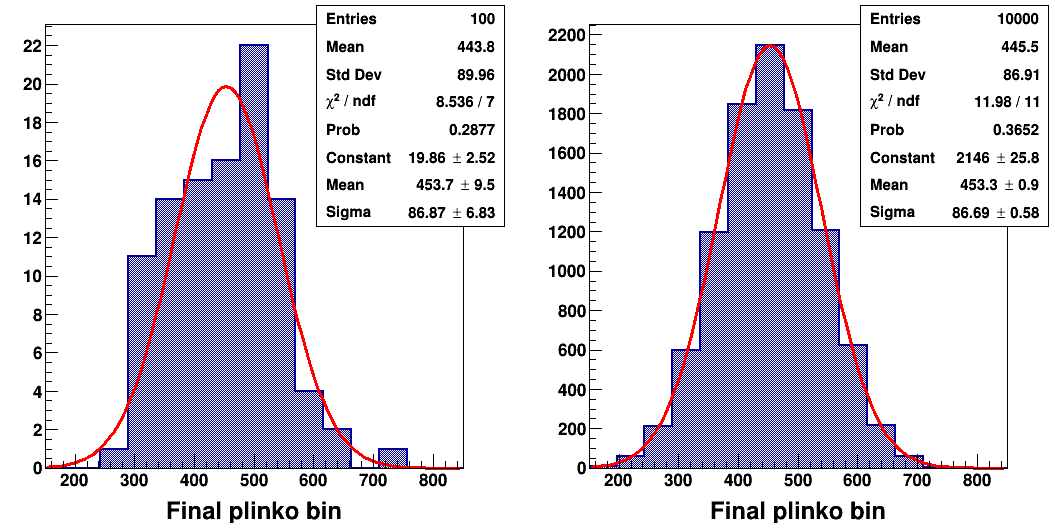
The end-bin plinko chip distribution is plotted within Fig. 2 where the bin size corresponds to the lattice spacing in the simulation. The left (right) panel throws 100 (104) plinko chips, and essentially a perfect Gaussian distribution is observed if the number of events is large as expected. Therefore, the ideal starting-position to get the 10k per chip on "The Price is Right" is the bin that aligns with the 10k bin. Note that I actually did watch a guy hit the 10k bin 3 out of 5 times which is highly unlikely, see this youtube video, and won $31.5k!